class: center, middle, inverse, title-slide # Xaringan short demo ## <br/>with a subtitle ### Jeroen Minderman ### 30/10/2019 (updated: 2019-10-30) --- --- class: center, middle # This is a centered slide with text in the middle. ### And some more text --- class: inverse, center, middle # This the same centered slide but with the colours reversed! :-) --- # We can do all our other tricks with making bullet points... - Like so - And so - And even nested lists work - Here you go With **xaringan** it is even easy to do incremental bits on slides, using the -- break instead of triple dashes to split slides. -- Like so. -- And so. --- # Footnotes Another cool convenience function is footnotes... so you can add bits at the bottom of the slide, like at the bottom of this slide. .footnote[ I am a footnote! ] -- In the next slide, you can see how you can have "background images" across the whole slide very easily, and tweak its size etc. --- background-image: url("https://live.staticflickr.com/3448/3190416619_d017f9c6a3_z.jpg") background-position: 50% 25% background-size: 35% class: center, bottom, inverse ## A shameless excuse to dig out my old photos... --- # More useful (boring) tricks? 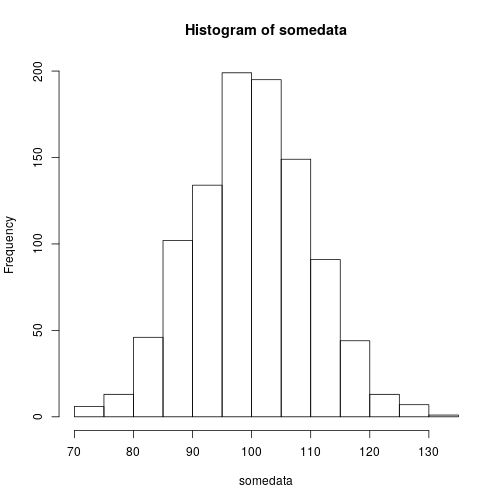<!-- --> --- # Extended useful tricks .pull-left[ ```r somedata = rnorm(1000, 100, 10) hist(somedata) ``` 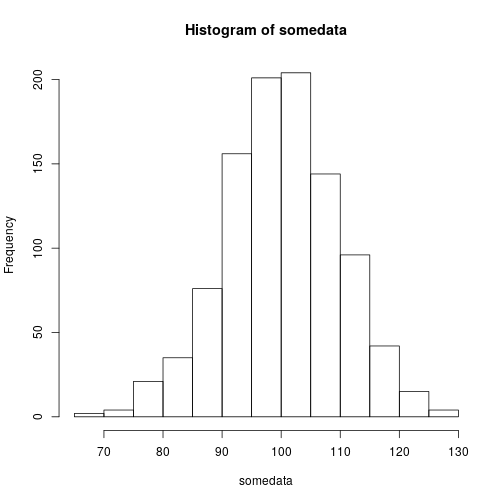<!-- --> ] .pull-right[ 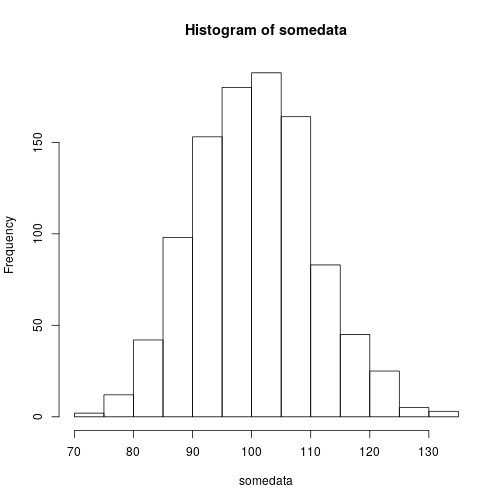<!-- --> ] --- # After the above, the use of include_graphics may be more interesting... ## Make your plot once; but include it anywhere: ```r somemoredata = data.frame(x = rnorm(1000, 0, 1), y = rpois(1000, 20)) png("someplot.png") plot(somemoredata$x, somemoredata$y) dev.off() ``` ``` ## png ## 2 ``` --- # And then print the plot on the next slide: .pull-left[ <img src="someplot.png" width="100%" /> ] .pull-right[ This means you can just repeat the figure where you need it... ] --- .left-column[ This is some text in the left column This is useful if you want some banner on the left ] .right-column[ And here is some on the right And main text on the right ] --- ---